
Page speed testing tools provide essential visibility into website performance, measuring loading times, identifying bottlenecks, and providing actionable recommendations for optimization. Understanding how different testing tools work, what metrics they measure, and how to interpret their results is fundamental to any web performance optimization effort. GTmetrix and Pingdom are two of the most popular page speed testing services, each offering distinct approaches to performance measurement and analysis. Alongside these, Google’s PageSpeed Insights, WebPageTest, and Chrome’s Lighthouse provide complementary testing capabilities that together create a comprehensive performance assessment toolkit.
This comparison examines the major page speed testing tools, covering their features, metrics, testing methodology, reporting capabilities, free and paid tiers, and optimal use cases. The analysis provides neutral evaluation to help website owners select the most appropriate testing tools for their performance optimization workflow.
GTmetrix Overview
GTmetrix is a comprehensive web performance testing service that combines Lighthouse-based analysis with proprietary performance metrics, waterfall visualization, and video playback of page loading. GTmetrix provides both free and paid testing tiers, with free testing available from a Vancouver, Canada test location using Chrome on a desktop connection. GTmetrix’s analysis includes a Performance Score (based on Lighthouse), Structure Score (based on audit results), and detailed breakdowns of individual performance metrics.
GTmetrix Features
Key GTmetrix features include: Lighthouse-based performance scoring with Core Web Vitals metrics; detailed waterfall chart showing individual resource loading timing and dependencies; video playback showing visual page loading progression; page comparison for testing before and after optimization changes; scheduled monitoring with email alerts for performance degradation; history tracking showing performance trends over time; and multiple test locations and connection speeds for simulating different user conditions. The Pro plan adds additional test locations, priority testing, and higher API limits.
Pingdom Overview
Pingdom (by SolarWinds) is a website monitoring and performance testing service that provides both speed testing and uptime monitoring. Pingdom’s speed test analyzes page load performance from multiple global test locations, providing a performance grade, load time, page size, and request count. Pingdom’s testing methodology focuses on practical loading metrics and resource analysis, providing a more accessible performance assessment than technically dense alternatives.
Pingdom Features
Key Pingdom features include: performance grade based on optimization best practices; page load time measured from multiple global test locations; detailed request breakdown showing each resource’s size, load time, and status; content size analysis by resource type (images, JavaScript, CSS, HTML); request analysis by domain showing third-party resource impact; and uptime monitoring with alerting (paid plans). Pingdom’s straightforward presentation makes it accessible for non-technical users who need to understand website performance.
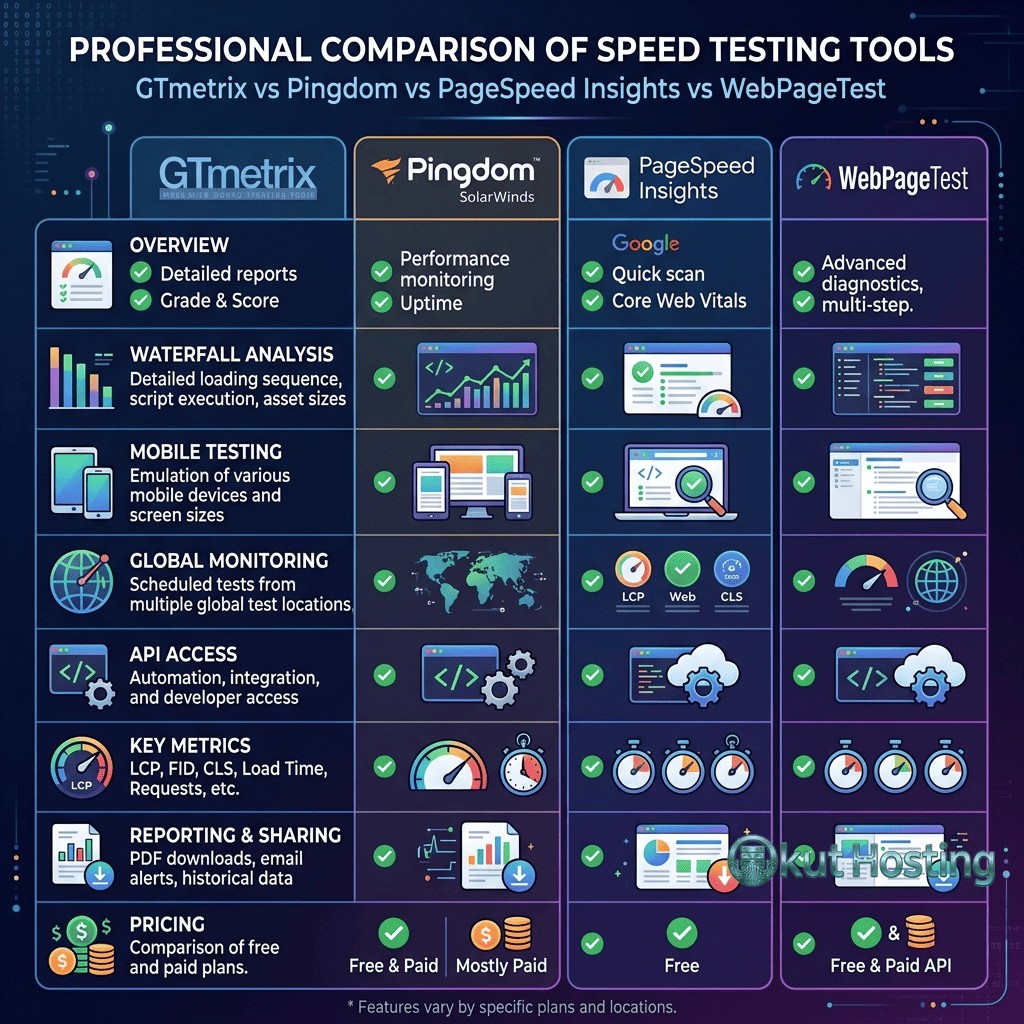
Google PageSpeed Insights
PageSpeed Insights (PSI) is Google’s free page speed testing tool that combines lab data (Lighthouse analysis) with field data (Chrome User Experience Report — CrUX). PSI is unique among testing tools because it shows how actual Chrome users experience the page (field data), not just how the page performs in a controlled test (lab data). PSI displays Core Web Vitals with pass/fail indicators based on the 75th percentile of field data, making it the definitive tool for understanding how Google evaluates page performance for search ranking purposes.
PSI provides: Core Web Vitals assessment using real-world CrUX data; Lighthouse performance audit with specific optimization recommendations; performance score (0-100) based on weighted metric assessment; and opportunity and diagnostic sections identifying specific improvements. PSI is essential for any SEO-focused performance optimization because it directly reflects Google’s assessment methodology.
WebPageTest
WebPageTest is an advanced, open-source web performance testing tool that provides the most detailed performance analysis available from any free testing service. Originally developed by AOL, WebPageTest provides: multi-step testing (simulating user workflows); multiple test locations and browser options; connection throttling for simulating various network conditions; filmstrip comparison for visual loading comparison; detailed waterfall charts with connection-level timing; request and response header inspection; and content blocking for testing third-party script impact.
WebPageTest excels for deep performance analysis and debugging specific performance issues. Its detailed waterfall charts and connection-level timing data provide insights that simpler tools cannot match. However, WebPageTest’s extensive data output can be overwhelming for users unfamiliar with web performance concepts.
Chrome Lighthouse
Lighthouse is Google’s open-source automated auditing tool for web page quality, available in Chrome DevTools, as a CLI tool, and as a Node.js module. Lighthouse provides audits across five categories: Performance, Accessibility, Best Practices, SEO, and Progressive Web App. The Performance category measures Core Web Vitals and provides specific optimization recommendations. Lighthouse’s integration with Chrome DevTools makes it the most accessible performance testing tool for developers already using Chrome for development.
GTmetrix vs Pingdom Detailed Comparison
Testing Methodology
GTmetrix uses Lighthouse as its analysis engine, providing Core Web Vitals metrics and structured audit recommendations. Pingdom uses its own testing methodology focused on practical load time measurement and resource analysis. GTmetrix’s Lighthouse-based approach aligns with Google’s performance assessment, while Pingdom’s approach provides simpler, more intuitive performance metrics.
Test Locations
GTmetrix free provides one test location (Vancouver); GTmetrix Pro provides 22+ test locations globally. Pingdom free provides 7 test locations across North America, Europe, Asia-Pacific, and South America. For testing global performance, both tools’ paid tiers provide adequate geographic coverage, though Pingdom’s free tier offers more location diversity.
Waterfall Analysis
Both tools provide waterfall charts, but GTmetrix’s waterfall provides more detailed timing breakdown including DNS, connection, TLS, waiting, and receiving phases for each request. Pingdom’s waterfall provides similar information with a simpler visual presentation. For detailed resource-level analysis, GTmetrix’s waterfall provides more actionable detail.
Monitoring
GTmetrix Pro provides scheduled monitoring with performance tracking and email alerts. Pingdom provides both speed monitoring and uptime monitoring with alerting and status pages. For comprehensive monitoring (performance + uptime), Pingdom provides a more complete monitoring solution.
Interpreting Test Results
Effective use of page speed testing tools requires understanding what the results mean and how to prioritize improvements. Key interpretation guidelines include: focus on field data (CrUX in PageSpeed Insights) for understanding actual user experience; use lab data for identifying specific issues to fix; prioritize Core Web Vitals metrics (LCP, INP, CLS) over aggregate scores; test from locations representative of actual visitor geography; test on connection speeds representative of actual visitor conditions; and run multiple tests to account for result variability.
Common Testing Mistakes
Common mistakes when using page speed testing tools include: testing only from one location (not representative of global audience); testing only on desktop (ignoring mobile, which Google prioritizes); comparing scores between different tools (each uses different methodology); making changes based on a single test (results vary between runs); focusing on score numbers rather than specific metrics; and not testing after changes to verify improvement. Avoiding these mistakes ensures that testing results lead to effective optimization decisions.
Testing Workflow for Optimization
An effective testing workflow for performance optimization follows these steps: establish baseline measurements using multiple tools from representative locations; identify the primary performance bottleneck (largest impact metric); implement targeted optimization addressing the specific bottleneck; re-test to verify improvement and measure the magnitude of change; repeat the process for the next priority bottleneck; and configure ongoing monitoring to detect future performance degradation. This iterative approach ensures systematic improvement rather than unfocused optimization attempts.
API Access and Automation
GTmetrix, Pingdom, PageSpeed Insights, WebPageTest, and Lighthouse all provide API access for automated testing. API-based testing enables: CI/CD pipeline integration for automated performance testing on deployments; scheduled testing across multiple pages and locations; custom dashboards aggregating results from multiple tools; and automated alerting when performance metrics exceed thresholds. For organizations with many pages or frequent deployments, API-based automated testing provides consistent performance monitoring without manual effort.
Free vs Paid Testing
Free tiers of testing tools provide adequate capabilities for basic performance assessment. Paid tiers add value through: more test locations for comprehensive geographic testing; higher testing frequency for monitoring; priority testing queues for faster results; advanced features (video comparison, multi-step testing); and higher API limits for automated testing. For individual websites with occasional testing needs, free tiers are sufficient. For agencies, e-commerce sites, or organizations requiring continuous monitoring, paid tiers provide necessary capabilities.
Mobile vs Desktop Testing
Testing both mobile and desktop configurations is essential because Google uses mobile-first indexing for search ranking. GTmetrix allows testing with mobile device emulation (simulating mobile viewport, CPU throttling, and network conditions). PageSpeed Insights provides separate mobile and desktop analysis tabs. WebPageTest offers extensive mobile device emulation options including specific device profiles. Pingdom does not provide mobile-specific testing, limiting its usefulness for mobile performance assessment. Since mobile performance typically scores lower than desktop due to reduced CPU and network capabilities, mobile testing often reveals performance issues not visible in desktop testing.
Third-Party Impact Analysis
Page speed testing tools help identify the performance impact of third-party scripts (analytics, advertising, social media, chat widgets). WebPageTest’s content blocking feature enables testing page performance with specific third-party domains blocked, quantifying each third-party’s impact on loading time. GTmetrix’s waterfall chart shows third-party resource loading timing and blocking behavior. PageSpeed Insights’ diagnostics section identifies third-party resources that impact performance. This third-party impact analysis enables informed decisions about which third-party services justify their performance cost and which should be removed, deferred, or replaced.
Competitor Benchmarking
Page speed testing tools enable benchmarking against competitor websites to understand relative performance positioning. Testing competitor pages with the same tools and settings provides comparative data for: page load times; Core Web Vitals metrics; page weight (total file size); request counts; and optimization scores. GTmetrix’s page comparison feature enables side-by-side comparison of different pages. This competitive benchmarking identifies performance advantages and disadvantages relative to industry peers, informing optimization priorities and performance targets.
WordPress-Specific Testing Considerations
WordPress sites benefit from testing-specific considerations: test with caching enabled and disabled to verify cache plugin effectiveness; test logged-in and logged-out states (WordPress adds admin bar and query parameters when logged in); test popular page types (homepage, blog posts, archive pages, WooCommerce product pages) as performance varies by template; and test after plugin installations and updates to detect performance regressions. WP-specific testing tools like Query Monitor (plugin) provide server-side performance data complementing external speed testing.
Performance Testing for CDN Verification
Page speed testing tools verify that CDN configuration is functioning correctly. Indicators of effective CDN operation include: response headers showing CDN cache hits (x-cache: HIT, cf-cache-status: HIT); resources served from CDN edge locations (visible in response headers); reduced TTFB for static assets compared to origin server delivery; and consistent performance across different test locations (indicating global edge delivery). Testing from multiple geographic locations before and after CDN implementation quantifies the performance improvement from CDN deployment.
Continuous Integration Testing
Integrating performance testing into CI/CD pipelines prevents performance regressions from reaching production. Lighthouse CI runs Lighthouse audits automatically on pull requests and deployments, comparing results against baseline budgets. GTmetrix and WebPageTest APIs enable automated testing triggered by deployment events. Performance gates (requiring minimum performance scores for deployment approval) enforce performance standards across the development team. This automated approach catches performance regressions at the development stage rather than discovering them in production monitoring.
Advanced WebPageTest Features
WebPageTest provides advanced testing capabilities beyond basic page speed measurement. Multi-step testing simulates user workflows (navigate to page, click button, submit form) providing performance data for interactive sequences. Custom scripting enables testing authenticated pages, form submissions, and complex user interactions. Visual comparison overlays filmstrip captures from different test runs, enabling visual comparison of loading sequences. Connectivity profiles simulate specific network conditions (3G, 4G, WiFi, cable) for realistic mobile testing. These advanced features make WebPageTest the most powerful free performance testing tool available.
Browser-Specific Performance Differences
Performance varies between browsers due to differences in rendering engines, JavaScript engines, and resource loading strategies. Chrome (Blink), Firefox (Gecko), and Safari (WebKit) each process CSS, JavaScript, and images differently, potentially producing different performance metrics for the same page. Testing across multiple browsers using WebPageTest (which supports Chrome, Firefox, and Safari) identifies browser-specific performance issues. However, since Chrome powers the CrUX data used by Google for search ranking, Chrome-based testing provides the most SEO-relevant performance assessment.
Result Variability and Statistical Significance
Page speed test results vary between runs due to network conditions, server load, and CDN cache state. A single test result may not accurately represent typical performance. Best practices for reliable results include: running multiple tests (3-5 minimum) and averaging results; using the median result rather than the best or worst single result; testing at different times of day to account for traffic-related server load variation; and using consistent test settings (location, connection speed, device emulation) for comparable results. GTmetrix’s monitoring feature addresses variability by providing trend data over time rather than relying on individual test results.
Custom Performance Metrics
Beyond standard metrics, custom performance metrics enable measuring application-specific loading milestones. The User Timing API allows developers to mark and measure specific performance events (time to render product images, time to interactive search, time to display pricing). These custom metrics capture business-relevant performance data that standard metrics may not reflect. Custom metrics can be reported through the web-vitals library and visualized in analytics platforms for ongoing monitoring of application-specific performance targets.
Tool Selection Recommendations
For Google ranking assessment: use PageSpeed Insights (field data reflects Google’s evaluation). For detailed technical analysis: use WebPageTest (most detailed waterfall and timing data). For regular monitoring: use GTmetrix Pro or Pingdom (scheduled testing with alerting). For development workflow: use Chrome Lighthouse (integrated with DevTools). For comprehensive assessment: use multiple tools together, as each provides complementary insights. The most effective approach combines PageSpeed Insights for SEO-relevant assessment with GTmetrix or WebPageTest for detailed technical analysis.
Cost Comparison Summary
Free testing options include: PageSpeed Insights (unlimited testing, field + lab data), WebPageTest (unlimited testing, advanced features), Chrome Lighthouse (built into Chrome DevTools), GTmetrix (limited free testing, one location), and Pingdom (limited free testing, multiple locations). Paid options include: GTmetrix Pro (from $14.95/month for monitoring and additional features), Pingdom (from $10/month for uptime + speed monitoring), SpeedCurve (from $15/month for continuous RUM), DebugBear (from $25/month for detailed monitoring), and Calibre (from $45/month for team performance monitoring). For most individual websites, free tools provide sufficient capabilities; paid tools are justified for continuous monitoring, team collaboration, and advanced analysis needs.
Summary
Page speed testing tools are essential instruments for understanding, optimizing, and monitoring website performance. GTmetrix provides comprehensive Lighthouse-based analysis with detailed waterfall visualization and monitoring capabilities. Pingdom provides accessible performance testing with uptime monitoring. PageSpeed Insights provides Google’s authoritative Core Web Vitals assessment using real-world user data. WebPageTest provides the deepest technical analysis for expert-level performance debugging. Chrome Lighthouse provides developer-focused auditing integrated with the browser. Using these tools effectively — understanding their strengths, interpreting results correctly, and following systematic optimization workflows — enables sustained website performance improvement.
Features, pricing, and capabilities discussed in this comparison reflect information available at the time of writing. Tool features and pricing change periodically. Okut Hosting is an independent review platform with no affiliate relationships with any company mentioned in this article.
For related guides, see our Core Web Vitals guide, our server response time guide, and our image optimization guide.