Uptime is the single most critical metric for evaluating shared hosting reliability because a website that is unavailable provides zero value to its visitors, generates zero revenue for its owner, and accumulates negative impact on search engine rankings and user trust. Despite its importance, uptime comparison between shared hosting providers is one of the most misunderstood aspects of hosting evaluation, complicated by misleading marketing claims, varying measurement methodologies, and the fundamental difficulty of objectively comparing reliability across different hosting environments.
This guide provides a structured approach to evaluating and comparing shared hosting uptime, covering the measurement methods, guarantee structures, independent monitoring tools, and analytical frameworks that enable meaningful provider reliability comparison. The goal is to equip hosting buyers with the knowledge needed to evaluate uptime claims critically and make informed decisions based on verifiable reliability data rather than marketing promises.
Understanding Uptime Metrics
Uptime is expressed as a percentage representing the proportion of time a hosting service is available during a given period. The industry-standard reference point is annual availability, with providers advertising uptime guarantees ranging from 99.9% to 99.999%. Understanding what these percentages mean in practical terms clarifies the actual reliability commitment each guarantee represents.
99.9% uptime allows approximately 8 hours and 46 minutes of downtime per year, or approximately 43 minutes per month. This is the most common shared hosting guarantee. 99.95% uptime allows approximately 4 hours and 23 minutes of downtime per year. 99.99% uptime allows approximately 52 minutes of downtime per year. 99.999% uptime allows approximately 5 minutes and 16 seconds of downtime per year. Each additional “nine” represents a tenfold improvement in availability commitment.
The practical difference between 99.9% and 99.99% uptime is significant: approximately 8 hours versus 52 minutes of annual downtime. For business websites where downtime directly impacts revenue, this difference can translate into measurable financial impact. For personal blogs and informational sites, the distinction between these uptime levels is less critical because occasional brief downtime has minimal practical consequences.
Downtime Impact Analysis
The financial and operational impact of hosting downtime varies dramatically depending on the type of website affected. E-commerce websites experience direct revenue loss during downtime — every minute of unavailability represents lost sales, abandoned shopping carts, and potential permanent customer loss. Business service websites lose lead generation opportunities and client access during outages. Content-driven websites lose advertising revenue and audience engagement during downtime periods.
Beyond direct financial impact, downtime affects search engine rankings. Google considers site availability as a ranking factor, and extended or frequent downtime can trigger ranking decreases that persist even after the site is restored. For websites that depend on organic search traffic for visitor acquisition, the SEO impact of poor uptime creates compounding costs that extend far beyond the actual downtime period.
Reputation impact is another significant downtime cost. Visitors who encounter unavailable websites form negative impressions that affect return visit likelihood and brand trust. For businesses establishing their online presence, early reliability issues can permanently damage visitor confidence and redirect potential customers to competitors with more reliable hosting.
Uptime Guarantees vs. Actual Performance
Hosting provider uptime guarantees are contractual commitments that specify the minimum availability level the provider pledges to maintain. When uptime falls below the guaranteed level, the provider’s Service Level Agreement (SLA) specifies compensation — typically account credits calculated based on the duration and severity of the downtime event.
Important distinctions exist between uptime guarantees and actual uptime performance. A 99.9% uptime guarantee does not mean the provider actually delivers 99.9% uptime — it means the provider will provide compensation if uptime falls below 99.9%. Actual uptime may be higher or lower than the guaranteed level. The guarantee establishes the floor below which compensation applies, not the ceiling of actual performance.
SLA fine print deserves careful reading because providers often exclude certain types of downtime from their guarantee calculations. Scheduled maintenance windows, customer-caused downtime (plugin conflicts, resource overuse), DNS-related issues, and force majeure events may be excluded from uptime calculations. These exclusions mean that total downtime experienced by website visitors may exceed the downtime that qualifies for SLA compensation.
Independent Monitoring Methods
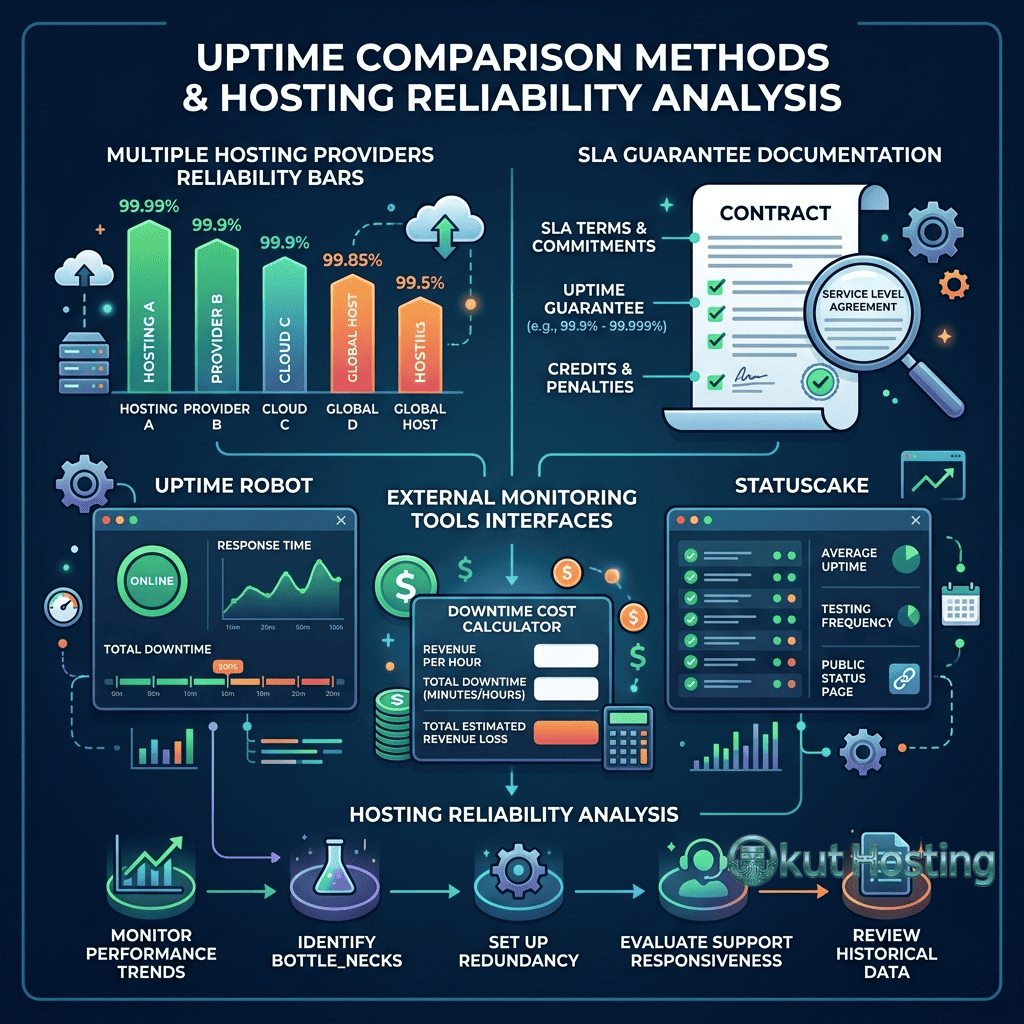
The most reliable approach to evaluating hosting uptime is independent monitoring — using third-party tools that continuously check website availability from external locations and record uptime data over extended periods. Independent monitoring eliminates the bias inherent in provider-reported uptime statistics and provides objective data for provider comparison.
External Monitoring Services
External uptime monitoring services like UptimeRobot, Pingdom, StatusCake, and Site24x7 check website availability at regular intervals (typically every 1 to 5 minutes) from multiple geographic locations. These services record response times, downtime incidents, and uptime percentages over configurable time periods. Many of these services offer free tiers that provide basic monitoring suitable for evaluating a single hosting account.
Setting up external monitoring immediately after establishing a hosting account provides objective uptime data from the beginning of the hosting relationship. Monitoring data collected over 30, 60, and 90-day periods provides increasingly reliable uptime performance baselines. Short-term monitoring (less than 30 days) may not capture intermittent reliability issues that manifest only under specific conditions or during specific maintenance periods.
Multi-Location Monitoring
Monitoring from multiple geographic locations provides more comprehensive availability assessment than single-location monitoring. Network routing issues, regional DNS problems, and geographic-specific connectivity issues may cause availability problems visible from some locations but not others. Multi-location monitoring captures these geographic-specific issues and provides a more accurate picture of actual availability as experienced by visitors worldwide.
Setting Up Uptime Monitoring
Implementing uptime monitoring requires selecting a monitoring service, configuring check parameters, and establishing alerting preferences. For basic uptime evaluation, UptimeRobot’s free tier provides 50 monitors with 5-minute check intervals — sufficient for monitoring a shared hosting account from multiple check angles. Configure monitors for HTTP/HTTPS checks on the main website URL, and optionally monitor specific pages, API endpoints, or resources that are critical to site functionality.
Alert configuration should include email and optionally SMS or push notification alerts for downtime events. Immediate alerts enable rapid response to availability issues, while post-incident reports provide documentation for SLA claims if the downtime qualifies for compensation under the hosting provider’s guarantee terms. Maintaining monitoring logs for at least 90 days provides sufficient data for evaluating hosting reliability trends and supporting informed migration decisions if reliability falls below acceptable levels.
Scheduled Maintenance Considerations
Hosting providers schedule maintenance windows for server updates, security patches, and infrastructure improvements. Scheduled maintenance typically occurs during low-traffic periods and is communicated in advance through email notifications or status page announcements. Understanding a provider’s maintenance scheduling practices helps set appropriate expectations for planned downtime events.
Some hosting providers exclude scheduled maintenance from uptime guarantee calculations, meaning that planned downtime does not count against the SLA commitment. This exclusion can create a gap between the marketed uptime guarantee and the actual total availability experienced by website visitors. When evaluating uptime guarantees, clarifying whether scheduled maintenance counts toward the guarantee calculation provides a more accurate understanding of the effective availability commitment.
Analyzing Independent Review Data
Independent hosting review sites that publish monitored uptime data provide aggregated performance information across multiple providers. When evaluating review-site uptime data, consider the monitoring methodology (monitoring frequency, location count, test type), the monitoring duration (longer monitoring periods provide more reliable data), and whether the monitored accounts represent typical shared hosting configurations or specially provisioned review accounts that may receive preferential treatment.
Comparing uptime data across multiple independent review sources provides more reliable assessments than relying on a single source. Consistent uptime performance reported across multiple independent monitors suggests genuine reliability, while discrepant results may indicate methodology differences or monitoring period variations that affect the data’s representativeness.
Server Response Time and Performance Correlation
While uptime measures binary availability (accessible or not), server response time provides a more nuanced measure of hosting reliability. A website that is technically “up” but responding with multi-second page loads provides a degraded experience that is functionally similar to downtime for visitors who abandon slow-loading pages.
Time to First Byte (TTFB) measures the time between requesting a page and receiving the first byte of the response. TTFB reflects server processing performance and is affected by server load, PHP execution speed, database query performance, and network latency. Consistently high TTFB values indicate hosting performance issues even when uptime metrics show 100% availability.
Monitoring both uptime and response time provides a complete picture of hosting reliability. A provider that delivers 99.99% uptime but with average TTFB values above 1 second provides a qualitatively different experience than a provider delivering 99.95% uptime with TTFB values consistently below 300 milliseconds.
Infrastructure Factors Affecting Uptime
Understanding the infrastructure factors that influence uptime helps evaluate provider reliability claims. Key infrastructure factors include: data center power redundancy (generator backup, UPS systems, multiple utility feeds), network redundancy (multiple internet carriers, BGP routing), hardware redundancy (RAID storage, server clustering), cooling system reliability, and physical security measures.
Providers that operate their own data centers have direct control over infrastructure quality, while providers that co-locate in third-party data centers depend on the facility operator’s infrastructure standards. Proprietary data center operations generally provide more control over infrastructure quality, but well-managed co-location in tier-certified data centers can provide equivalent or superior infrastructure through the data center operator’s specialized expertise and scale.
Shared Hosting-Specific Reliability Factors
Shared hosting introduces reliability factors that do not exist in VPS or dedicated server environments. Server oversubscription — the practice of hosting many accounts on a single server — creates resource contention that can affect availability when individual accounts consume excessive resources. The “noisy neighbor” effect occurs when resource-intensive accounts on the same server degrade performance or availability for other accounts sharing the server.
Provider account density policies significantly influence shared hosting reliability. Providers that limit account density per server reduce resource contention and improve per-account reliability. Budget providers that maximize account density may deliver lower effective uptime because resource contention events cause more frequent performance degradation or availability issues.
Evaluating Provider Reliability Track Records
Long-term provider reliability assessment considers the provider’s operational history, incident response track record, and communication practices during outages. Providers that publish status pages with real-time infrastructure status and historical incident data demonstrate transparency about reliability performance. Reviewing a provider’s status page history reveals the frequency, duration, and communication quality of past incidents.
Customer reviews and independent forum discussions provide anecdotal but useful reliability perspectives. While individual reviews may reflect unusual circumstances, consistent reliability complaints across multiple independent sources suggest systemic issues. Similarly, consistent praise for reliability across multiple sources suggests genuine performance quality.
Uptime Comparison Framework
A structured approach to comparing uptime across providers should consider: the uptime guarantee percentage and SLA terms, independent monitoring data from multiple review sources, infrastructure documentation and data center specifications, customer review sentiment regarding reliability, provider status page transparency and incident history, and the provider’s operational longevity and market position.
Weighting these factors based on their reliability as indicators helps create a balanced assessment. Independent monitoring data provides the most objective evidence, followed by infrastructure documentation and SLA terms. Customer reviews provide supplementary context, while marketing claims about uptime should be weighted least because they are not independently verified.
Cost-Reliability Relationship
Hosting pricing generally correlates with infrastructure investment and reliability. Premium shared hosting providers like Liquid Web and SiteGround invest more heavily in infrastructure redundancy, server management, and support quality — investments that support higher uptime performance. Budget providers achieve lower pricing partly through infrastructure optimization that may accept marginally lower reliability as a trade-off for cost reduction.
The cost-reliability relationship is not linear — the most expensive shared hosting does not automatically provide the highest uptime, and budget hosting does not automatically provide the lowest. Some budget providers maintain excellent uptime through efficient infrastructure management, while some premium providers may experience reliability issues despite higher pricing. Independent monitoring data provides the objective evidence needed to evaluate whether pricing correlates with reliability for specific providers.
CDN Impact on Effective Uptime
Content Delivery Network integration can improve effective website availability by serving cached content from edge locations even when the origin hosting server experiences downtime. CDN edge servers cache static content — images, CSS, JavaScript, and static HTML — that can be served to visitors during brief origin server outages. This CDN buffering effect means that visitors may experience a functional, albeit potentially stale, version of the website during hosting downtime events, improving the effective availability as perceived by visitors.
CDN integration does not replace hosting uptime — dynamic content, database-driven features, forms, and e-commerce functionality require the origin server to be available. However, CDN caching provides a partial availability improvement that reduces the visible impact of brief hosting outages on visitor experience. For content-driven websites where the majority of traffic accesses static content, CDN caching can significantly reduce the perceived impact of hosting availability issues.
Geographic Uptime Variations
Hosting uptime can vary geographically depending on network routing, CDN edge location availability, and regional connectivity conditions. A hosting server may be fully operational but inaccessible from specific geographic regions due to network routing issues, ISP connectivity problems, or regional DNS resolution failures. Multi-location monitoring captures these geographic-specific availability issues that single-location monitoring misses, providing a more accurate picture of the uptime experience across the full visitor audience.
Understanding geographic uptime variations is particularly important for websites serving international audiences. A hosting provider with excellent uptime from US monitoring locations may deliver lower effective availability for visitors from Asia or Africa due to longer network paths and additional failure points in the routing chain. CDN integration mitigates these geographic reliability gaps by serving content from edge locations that are closer to the visitor’s geographic location.
Provider Uptime Profile Examples
Different hosting providers approach uptime guarantees with varying levels of aggressiveness and accountability. SiteGround guarantees 99.99% uptime backed by Google Cloud Platform infrastructure. Hostwinds offers a 99.999% guarantee — one of the most aggressive in shared hosting. Liquid Web provides a 100% network uptime SLA with proactive monitoring. DreamHost guarantees 100% uptime with service credits for any downtime. Bluehost and HostGator guarantee standard 99.9% uptime under Newfold Digital’s SLA terms.
The guarantee aggressiveness often reflects the provider’s infrastructure investment and confidence in their reliability capabilities. Providers offering 99.99% or higher guarantees typically invest in redundant infrastructure, proactive monitoring, and rapid incident response that supports the higher availability commitment. However, guarantee levels alone do not determine actual performance — independent monitoring provides the verification that marketing guarantees cannot.
Summary
Evaluating shared hosting uptime requires moving beyond marketing claims and uptime guarantee percentages to examine independently verified monitoring data, infrastructure quality indicators, and provider reliability track records. The most reliable uptime assessment combines external monitoring tools, multi-source independent review data, SLA analysis, and infrastructure evaluation into a comprehensive reliability picture.
For hosting buyers prioritizing reliability, implementing independent monitoring on any hosting account provides objective performance data that enables informed decisions about whether the current hosting provider meets reliability requirements or whether a migration to a more reliable alternative is justified. The methodical approach to uptime evaluation described in this guide enables fact-based provider comparison that produces better hosting decisions than relying on marketing promises alone.
This guide provides general methodology for evaluating shared hosting uptime. Specific uptime performance varies by provider, plan, and individual hosting environment. Okut Hosting is an independent review platform with no affiliate relationships with any hosting company mentioned in this article.
For related content, see our SiteGround performance review, our Liquid Web shared review, and our shared hosting limitations guide.